Twenty-eight percent of the Prometheus certification is a query language. PromQL, the expression language you type into the Prometheus server to select, rate and aggregate time series, is the single largest domain on the Prometheus Certified Associate exam, ahead of the architecture, the alerting and the instrumentation material that most people picture when they think about monitoring. The exam itself is short and approachable: 60 multiple-choice questions in 90 minutes, 75 percent to pass, $250 for the exam alone, and no prerequisites.
That combination makes PCA easy to underestimate. A candidate who has run Prometheus for a year, clicking through Grafana dashboards someone else built, often knows the architecture well and the query language poorly. This guide follows the Linux Foundation’s own five domain weighting, explains what each one asks, and spends the most time where the marks are.
Table of Contents
- What Is the Prometheus Certification?
- Who Is the Prometheus Certified Associate Written For?
- How Is the PCA Exam Weighted?
- Why Does PromQL Carry 28 Percent of the Exam?
- What Do Prometheus Fundamentals and Instrumentation Test?
- How Are Observability Concepts and Alerting Examined?
- How Should You Prepare for the Prometheus Certified Associate?
- Where PCA Leads After You Pass
- Frequently Asked Questions
- Conclusion
What Is the Prometheus Certification?
The Prometheus certification is the Prometheus Certified Associate, exam code PCA, run by the Linux Foundation with the Cloud Native Computing Foundation. It tests foundational observability knowledge and practical Prometheus skills: scraping targets, writing PromQL, instrumenting code and configuring alerts. It is 60 questions in 90 minutes, 75 percent to pass, and $250 for the exam only.
| Exam detail | Value |
|---|---|
| Exam name | Linux Foundation Prometheus Certified Associate |
| Exam code | PCA |
| Questions | 60 |
| Duration | 90 minutes |
| Passing score | 75% |
| Price | $250 USD, exam only |
| Format | Online, proctored, multiple choice |
| Prerequisites | None |
| Recommended course | Monitoring Systems and Services with Prometheus (LFS241) |
| Validity | Two years |
The purchase includes one retake and twelve months of exam eligibility from the date you buy. Two bundles are sold alongside the exam: the LFS241 course plus the exam for $299, and the exam with the THRIVE-ONE annual subscription for $495. If you only want the credential and already know Prometheus, the exam alone is the sensible buy.
What the credential actually proves
The Linux Foundation describes PCA as a pre-professional certification. It confirms that you can build or scrape observability data in an application stack, whether or not that stack is cloud native, and that you can use the resulting data to troubleshoot and to feed other systems. It does not claim you can run Prometheus at very large scale, and it does not cover long-term storage projects or managed services.
Who Is the Prometheus Certified Associate Written For?
The Prometheus Certified Associate is written for engineers and application developers with a particular interest in observability and monitoring. The Linux Foundation rates it beginner level and sets no prerequisites, though it names KCNA, CKA or CKAD holders, and people who have finished Prometheus training or a cloud engineer bootcamp, as the ideal candidates.
In practice that covers three groups. Site reliability and platform engineers who already run Prometheus and want proof of the fundamentals. Application developers who are asked to expose metrics from their own services and need to understand what happens to those numbers after scraping. And data engineers who treat metrics as one more time series feed, because Prometheus is, underneath, a labelled time series database with its own query language.
“Like the certifications before it, the PCA gives developers the ability to officially demonstrate their skills in understanding Prometheus and modern observability systems.”
The exam went generally available in September 2022 after several months of beta testing, as the CNCF launch announcement records. It has kept the same five domain structure since, which makes the published curriculum a reliable study map.
Who should probably wait
Someone who has never seen a metrics endpoint will find the paper hard despite the beginner label. The questions assume you have looked at real scrape output, written at least a few queries and read an alerting rule. A week of hands-on time with a local Prometheus server before booking is the cheapest way to close that gap, and working through a PCA practice exam afterwards shows which domains still cost you marks.
How Is the PCA Exam Weighted?
The PCA exam is weighted across five domains. PromQL is the largest at 28 percent, Prometheus Fundamentals carries 20 percent, Observability Concepts and Alerting and Dashboarding take 18 percent each, and Instrumentation and Exporters is the smallest at 16 percent. The Linux Foundation publishes these weights alongside the objective list, so preparation can follow them exactly.
| Domain | Weight | Objectives |
|---|---|---|
| Observability Concepts | 18% | Metrics; understand logs and events; tracing and spans; push vs pull; service discovery; basics of SLOs, SLAs and SLIs |
| Prometheus Fundamentals | 20% | System architecture; configuration and scraping; understanding Prometheus limitations; data model and labels; exposition format |
| PromQL | 28% | Selecting data; rates and derivatives; aggregating over time; aggregating over dimensions; binary operators; histograms; timestamp metrics |
| Instrumentation and Exporters | 16% | Client libraries; instrumentation; exporters; structuring and naming metrics |
| Alerting & Dashboarding | 18% | Dashboarding basics; configuring alerting rules; understand and use Alertmanager; alerting basics (when, what, and why) |
A 75 percent pass mark on 60 questions means 45 correct answers, so you can afford to lose 15. That is roughly the size of the whole Instrumentation and Exporters domain, which is a useful way to picture the margin: there is room for one weak area, not two. The Linux Foundation does not publish a per domain question count, so the percentages are the only guide to how many questions each area produces. The same weights and objective list appear on the official PCA curriculum, which is worth rechecking before you book.
Why Does PromQL Carry 28 Percent of the Exam?
PromQL carries 28 percent of PCA because it is how every other part of Prometheus gets used. Dashboards are PromQL expressions, alerting rules are PromQL expressions with a threshold and a duration, and troubleshooting is PromQL typed into the expression browser. A candidate who cannot read a query cannot really use the data the other domains describe collecting.
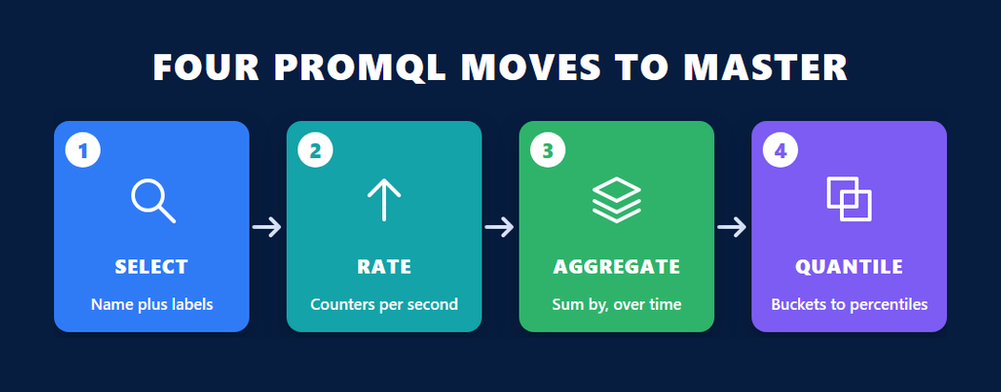
The seven objectives are selecting data, rates and derivatives, aggregating over time, aggregating over dimensions, binary operators, histograms and timestamp metrics. They build on each other, so study them in that order rather than jumping straight to histograms.
Selecting data and the instant versus range distinction
Every query starts with a selector: a metric name and a set of label matchers, which can be equality, inequality or regular expression matches. The first concept that trips people is the difference between an instant vector, one sample per series at a moment, and a range vector, a window of samples per series written with a duration in square brackets. Many functions accept only one of the two, and a surprising share of wrong answers comes from passing the wrong kind.
Rates, counters and why rate() exists
Counters only go up and reset to zero when a process restarts, so their raw value is almost never what you want. The rate() function turns a counter range into a per second average and handles resets for you, irate() uses only the last two samples, and increase() expresses the same change over the whole window. Know which one suits a dashboard, which suits an alert, and why rate() should be taken before sum(), not after. The official PromQL querying basics page is the right depth for all of this.
Aggregation, operators and histograms
Aggregating over dimensions means operators such as sum, avg, max and count with by or without clauses that decide which labels survive. Aggregating over time means the over_time family, such as avg_over_time and max_over_time, applied to a range. Binary operators add arithmetic, comparison and set operations between vectors, together with the label matching rules that decide which series pair up. Histograms close the domain: histogram_quantile() estimates a quantile from cumulative bucket counters, and the exam expects you to know that rate() is applied to the buckets first.
What Do Prometheus Fundamentals and Instrumentation Test?
Prometheus Fundamentals, at 20 percent, tests the architecture, scrape configuration, the data model and labels, the exposition format and the system’s known limitations. Instrumentation and Exporters, at 16 percent, tests how metrics get into Prometheus in the first place: client libraries, instrumenting your own code, exporters for third party systems, and naming metrics well.
Architecture and scraping
Expect questions on the parts of a Prometheus deployment: the server that scrapes and stores, targets that expose an HTTP metrics endpoint, service discovery that finds those targets, Alertmanager that handles notifications, and the Pushgateway for short-lived batch jobs that cannot be scraped. Scrape configuration covers jobs, intervals, timeouts and relabelling, and you should be able to read a scrape_configs block and say what it will collect.
Data model, labels and limitations
A time series is identified by its metric name plus its full set of label pairs, so every distinct label combination is a separate series. That is why high cardinality labels, such as user IDs or request paths with unbounded values, are the classic way to overload a server. The limitations objective also covers what Prometheus is not designed for: it favours reliability of the monitoring system over perfect accuracy, keeps local storage on a single node, and is not a store for logs, events or exact billing data.
Instrumentation and the four metric types
Client libraries give you four metric types: counters, gauges, histograms and summaries. The exam asks when each fits, for example a counter for requests served, a gauge for queue depth, and a histogram rather than a summary when you need to aggregate quantiles across instances. Exporters translate metrics from systems you cannot instrument directly, such as the node exporter for host metrics. Naming follows the project’s conventions: a single unit in base units, a suffix such as _total for counters, and labels for dimensions rather than metric names.
How Are Observability Concepts and Alerting Examined?
Observability Concepts and Alerting and Dashboarding each carry 18 percent of PCA. The first tests the vocabulary around Prometheus: metrics versus logs, events and traces, push versus pull collection, service discovery and service level indicators. The second tests turning data into action: dashboard basics, writing alerting rules, and how Alertmanager routes, groups and silences notifications.
The concepts domain is broader than Prometheus
This is the one domain that is not purely about the tool. You need to explain why Prometheus pulls rather than waits for pushes, what tracing and spans record that metrics cannot, and how an SLI, an SLO and an SLA relate. The definitions in the Google SRE book chapter are the standard reference most exam questions on this objective lean on: an indicator is the measured quantity, an objective is the target for it, and an agreement is the contract with consequences attached.
Alerting rules and Alertmanager
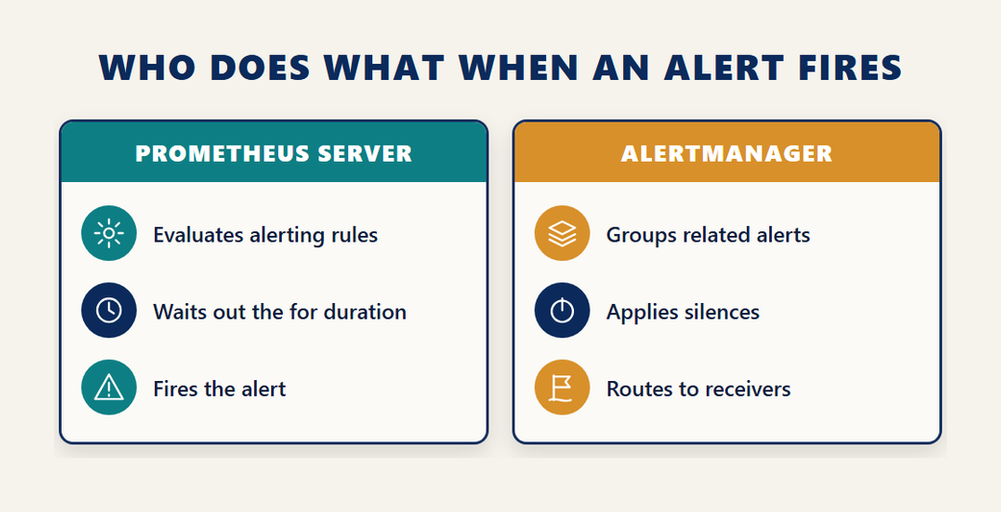
The most common confusion here is about which component does what. The Prometheus server evaluates alerting rules, which are PromQL expressions with an optional for duration, and fires alerts when a condition holds long enough. Alertmanager never evaluates a query. It receives fired alerts, groups related ones, applies inhibition and silences, and routes the result to receivers such as email, chat or paging tools. The alerting basics objective adds judgement: alert on symptoms users feel rather than every cause, and make every page actionable.
Dashboarding basics
Dashboarding is the lightest objective in the domain. Expect questions on choosing a sensible query for a panel, rate windows that suit the scrape interval, and the difference between a dashboard for exploration and one for an on call view. The blueprint names no specific dashboard product, so concentrate on the queries behind panels rather than any tool’s menus. Every objective across all five domains is listed as a single checklist in our Prometheus Associate topic notes.
How Should You Prepare for the Prometheus Certified Associate?
Prepare for the Prometheus Certified Associate by following the weighting and doing everything against a running server, even though the exam is multiple choice. Three to five weeks is realistic for someone who already uses Prometheus at work. The sequence below spends the most time on PromQL and the fundamentals, which together carry 48 percent of the marks.
- Run a local Prometheus server and a node exporter, then read the raw output of the metrics endpoint until the exposition format and the labels in it feel familiar.
- Write the scrape configuration yourself, add a second job with service discovery or a static target, and break it on purpose so the targets page shows you the failure.
- Work through PromQL in the order of the blueprint, from selectors to rates, aggregation, binary operators and histograms, predicting each result before you run the query.
- Instrument a small application with a client library, exposing one counter, one gauge and one histogram with sensible names and units.
- Write two alerting rules with a for duration, send them to a local Alertmanager, and practise grouping and a silence.
- Finish with timed practice at 90 seconds per question, logging every wrong answer against the domain it came from so the remaining hours go to the weakest area.
“The market demand by both engineers and employers for a reliable baseline of Prometheus knowledge is proof positive that Prometheus and its ecosystem have crossed the chasm.”
Where to study from
The official Prometheus documentation is the primary source and covers every objective. LFS241 is the Linux Foundation’s own course for the exam if you prefer a guided path, and the bundle price is only $49 more than the exam on its own. Keep the curriculum open while studying: if a topic is not on it, it is not on the exam.
Where PCA Leads After You Pass
PCA is an associate credential, so it sits at the start of a path rather than the end. The natural next steps are either broader observability, through OpenTelemetry, or deeper Kubernetes skills, through the Linux Foundation’s administrator and developer exams. Which one fits depends on whether your work leans toward telemetry pipelines or toward running the platform itself.
For engineers whose job is collecting telemetry across services, OpenTelemetry is the obvious companion. It covers traces, metrics and logs with one set of APIs and a collector, and it is where the tracing and spans objective of PCA leads. Our OpenTelemetry associate guide covers that exam’s topics.
For platform engineers, Prometheus knowledge pays off most on Kubernetes, where the Prometheus Operator and service discovery are standard. The certificate itself stays valid for two years, so plan the next exam inside that window if you want the credentials to read as a continuous path.
Frequently Asked Questions
How many questions are on the Prometheus certification exam?
The Prometheus Certified Associate exam has 60 multiple-choice questions with a 90 minute limit. That works out to 90 seconds a question, so pace matters less than knowing PromQL well.
What is the passing score for PCA?
The passing score is 75 percent. On 60 questions that means 45 correct answers, leaving room to miss 15.
How much does the Prometheus certification cost?
The exam alone is $250 USD. The Linux Foundation also sells it with the LFS241 course for $299 and with the THRIVE-ONE annual subscription for $495. Each purchase includes one retake.
Are there prerequisites for the Prometheus Certified Associate?
No. Anyone can register. The Linux Foundation rates it beginner level and suggests that candidates holding KCNA, CKA or CKAD, or who have done Prometheus training, are a good fit.
Is the PCA exam hands-on?
No. It is an online, proctored, multiple-choice exam. Practising on a real server still helps, because many questions describe output you would only recognise from using one.
Which PCA domain carries the most weight?
PromQL, at 28 percent. Prometheus Fundamentals follows at 20 percent, Observability Concepts and Alerting and Dashboarding take 18 percent each, and Instrumentation and Exporters carries 16 percent.
How long is the Prometheus certification valid?
The certification is valid for two years. You have twelve months from purchase to sit the exam, including the retake.
Does the PCA exam cover Grafana?
The curriculum names dashboarding basics but no dashboard product. Expect questions about the queries behind panels rather than about any particular tool’s interface.
Does Alertmanager evaluate alerting rules?
No. The Prometheus server evaluates alerting rules and fires alerts. Alertmanager receives them, groups them, applies silences and inhibition, and routes notifications to receivers.
How long should I study for PCA?
Three to five weeks suits someone who already uses Prometheus. Newcomers should add a week or two of hands-on time with a local server before starting exam preparation.
Conclusion
The Prometheus certification rewards people who can read and write queries, not just people who have kept a monitoring stack running. PromQL is the largest of the five domains at 28 percent, and alerting rules and dashboards both depend on it, so its real share of the exam is larger still.
Build your preparation the same way: a local server, scrape configuration written by hand, PromQL in blueprint order, one instrumented application and two alerting rules routed through Alertmanager. With 60 questions, 90 minutes and a 75 percent pass mark, there is room for one weak domain. Make sure it is not the query language, then book the exam.


